Flat graph on product page
When a graph on the product page shows up flat, like so:
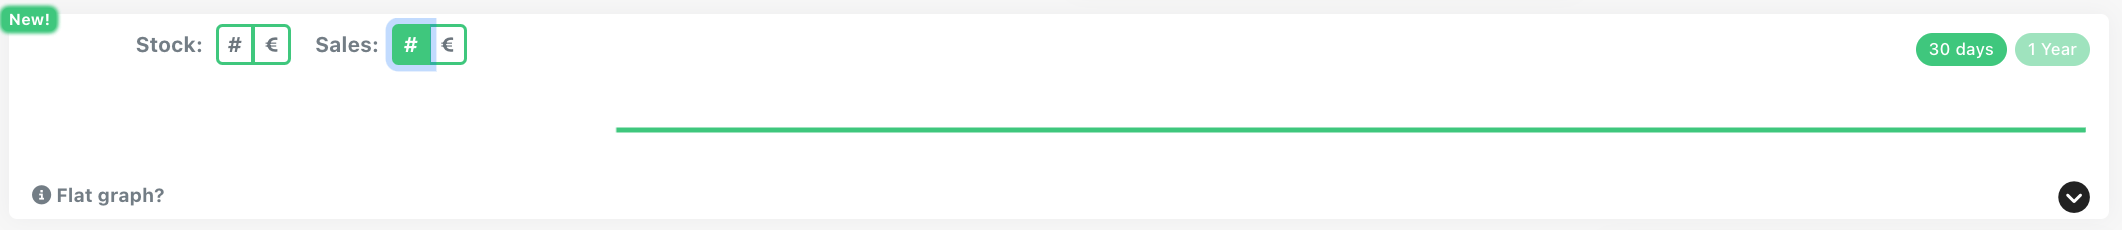
This has one of the following causes:
If the graph is flat at 0:
- For Stock Amounts (#): because the stock (inventory) is 0
- For Stock Value (€): Either because (1) because the stock (inventory) is 0, or (2) because no price was available in ChannelDock at this point in history
- For sales Amounts (#): because no sales were made at this point
- For sales value (#): Either because (1) because the stock (inventory) is 0, or (2) because no price was available in ChannelDock at this point in history
If the graph is flat at some other value:
- For Stock Amounts (#): because the stock has remained constant over this period of time
- For Stock Value (€): because the stock has remained constant over this period of time
- For sales Amounts (#): because sales were constant over this period of time
- For sales value (#): because sales were constant over this period of time
If the graph does not function well, feel free to contact support.