Flat graphs
When a graph on the product page shows up flat, like so:
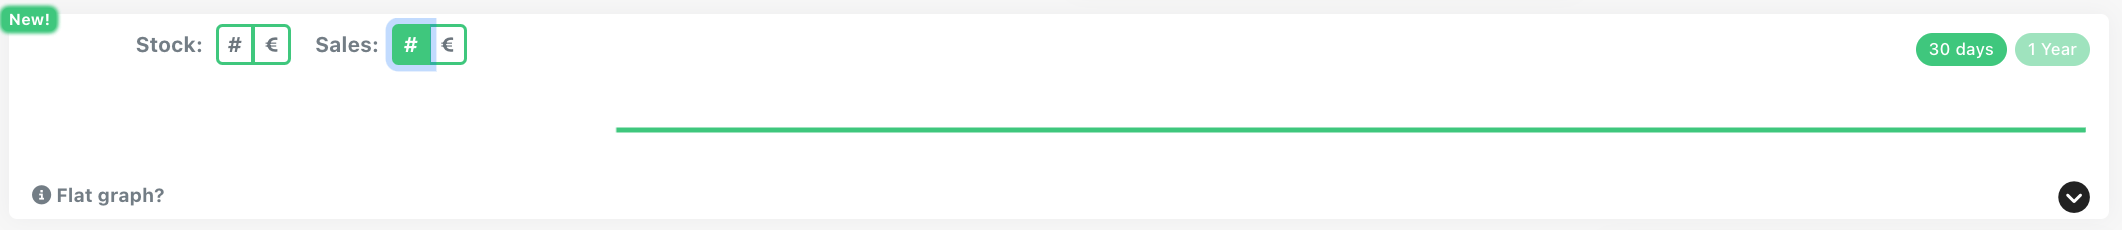
This has one of the following causes:
If the graph is flat at 0:
- For Stock Amounts (#): because
therethehavestockbeen(inventory)noischanges in inventory0 - For Stock Value (€): Either because (1)
nobecausepricethehasstockbeen(inventory)added,is 0, or (2) because nosalespricewerewasmadeavailableandinsoChannelDocktheatstockthisvaluepointhasinnot changedhistory - For sales Amounts (#): because
there have beennochangessalesinwereinventorymade at this point - For sales value (#): Either because (1)
nobecausepricethehasstockbeen(inventory)added,is 0, or (2) because nosalespricewerewasmadeavailableandinsoChannelDock at this point in history
If the graph is flat at some other value:
- For Stock Amounts (#): because the stock
valuehas remained constant over this period of time - For Stock Value (€): because the stock has
notremainedchangedconstant over this period of time - For sales Amounts (#): because sales were constant over this period of time
- For sales value (#): because sales were constant over this period of time
If the graph does not function well, feel free to contact support.